Early Feasibility Assessment

About

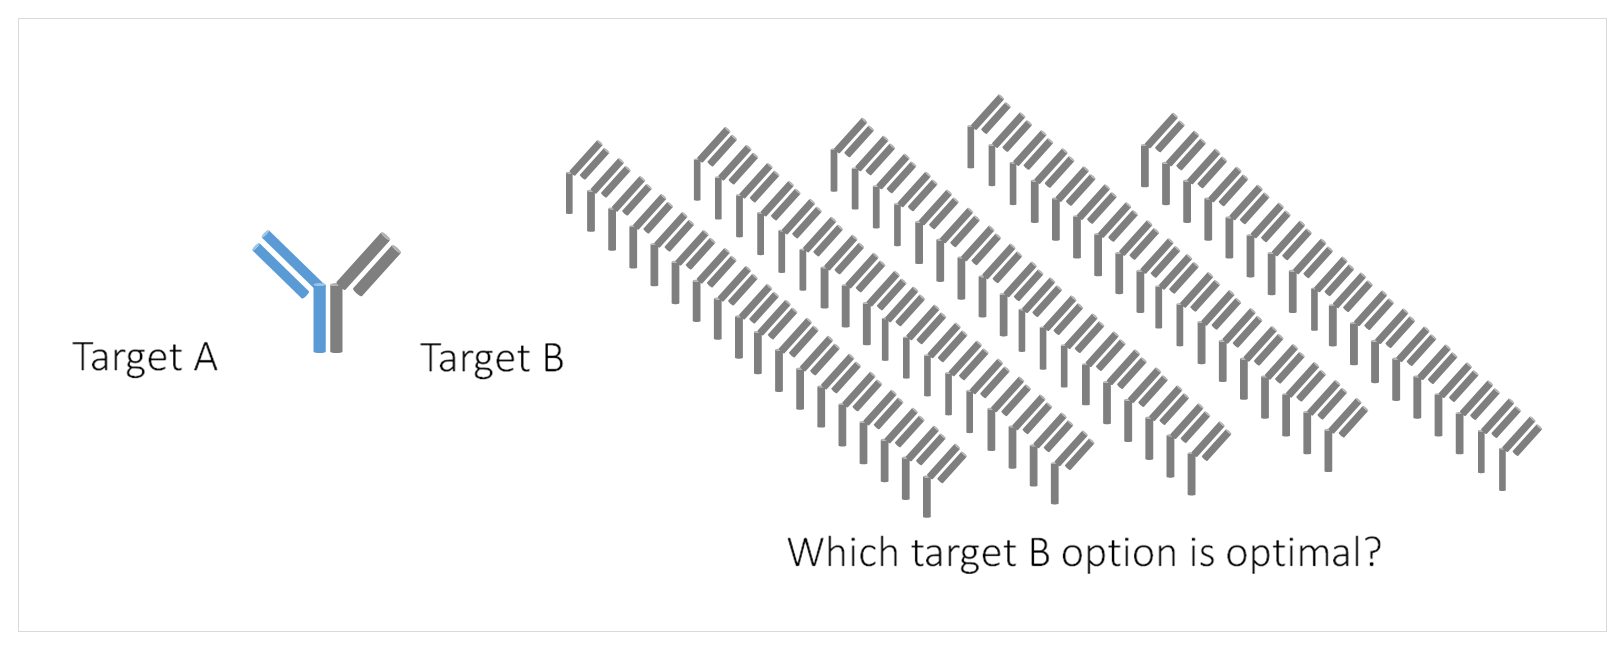
When designing a biological therapeutic agent, it is critically important to establish the feasibility of achieving a desired target product profile (TPP) as early in the program as possible, typically at the ‘New Target Proposal Stage’ or at the start of Lead Identification. In this case study, our partner was at the target selection stage for a bispecific agent that would hopefully work across four potential indications. They had confirmed one target, the anchor epitope (Target A), but were undecided as to the second target (Target B); based on the biology of their indications, they had 90 potential targets from which to choose, all with equally compelling biology as the project was very early (Figure 1).  

To be competitive, according to the TPP, the ideal dosing regimen was monthly, or less frequent, subcutaneous (SC) administration, and acceptable was weekly SC dosing.  Due to resource constraints, they needed to reduce the number of potential combinations to a low number. The partner requested our help in prioritizing a small set of target combinations to pursue further.

Results

  1. We reduced the search space from 90 to 4 viable potential target B options. This resulted in developing a platform and projects that could be executed in a timely fashion and reasonable costs.


  2. By significantly reducing the number of targets to explore, our partners was able to eliminate dead ends before significant investment, saving potentially millions of dollars and years of time and accelerate timelines for their promising candidates
EFA case study
Figure 1: Schematic of customer problem.


Methods

Using Applied BioMath’s proprietary technology, we built quantitative systems pharmacology (QSP) models for each hypothetical Target A + B combination; with these models we created affinity vs dose requirement curves for each potential Target B (Figure 2). The graph in Figure 2 illustrates the relationship between affinity and dose. In theory, as the affinity of an antibody for its target increases, the dose required to maintain at least 90 percent target inhibition for the whole dosing interval decreases; however, a tradeoff exists between affinity and developability, i.e. it is harder to develop a high affinity inhibitor.  Solubility is also another concern in developing a biologic, that is, it may be relatively easy to develop a bispecific at 100 mg/ml, but more difficult at 150 mg/ml Therefore, the “sweet spot” is to develop an agent that is just potent enough to avoid high dosing, or high solubility; in Figure 2 this sweet spot is colored green. 

Based on these curves, we triaged targets based on the level of difficulty in developing an agent that would meet the dosing requirement. For example, targets where a very high-affinity antibody would be required to meet the dosing requirement are less attractive than those where a lower affinity antibody could meet the dosing requirement.

Figure 2. An example dose vs. affinity curve for a hypothetical target. Developability regions are colored in green, yellow, and red, corresponding with easy, medium, and difficult levels of developability respectively. The dotted lines indicate the window of uncertainty in the QSP simulations, based on factors such as antibody half-life, etc. Ideal targets are those where their curves go through the yellow and green regions, indicating that they would be relatively easy to develop.

affinity curve

Results

Based on our approach, we reduced the search space from 90 to 4 viable potential target B options. This resulted in developing a platform and projects that could be executed in a timely fashion and reasonable costs. This can be generalized, e.g., 2 dosing regimens, 4 indications, and N targets (Figure 3). By significantly reducing the number of targets to explore, our partner was able to:

  • Eliminate dead ends before significant investment, saving potentially millions of dollars and years of time
  • Accelerate timelines for their promising candidates

dose regimen

Figure 3. Generalized example: Prioritized target candidates for two dosing regimens across four indications. For example, colored circles indicate the ease of developing an antibody against the target that satisfies the dosing requirement for the indication (green = easy, yellow = medium, red = hard, black = very hard / not possible, blank = insufficient data)

Download the Case Study